---
title: A simple introduction to linear regression
date: "2025-09-29"
author: "Seth Frandsen"
format:
html:
code-fold: true
toc: true
toc-depth: 3
---
## Introduction
Linear regression is a statistical method used to model the relationship between a dependent variable and one or more independent variables.
it is widely used in various fields such as economics, biology, and social sciences to understand how changes in the independent variables affect the dependent variable.
it can be be very very useful and is very easy to implement.
## What is Simple Linear Regression?
simple linear regression models the relationship between a dependent variable **y**
and an independent variable **x**
by fitting a straight line through the data points. The model can be expressed with the formula:
$$y=β_0
+β_1x+ϵ $$
Where β_0 is the intercept, β_1 is the slope of the line, and ϵ is the error term.
The slope is the rate at which y increases when x increases. A simple way to think of this is that for each increase in β_1 then the β_0 will increase an amount.
ϵ in this case is the error term and represents random noise, unmeasured factors, or inherent variability in the data that cannot be explained by the linear relationship between x and y.
Using this model, we can make predictions about the value of y based on the value of x. It is very simple to implement,
and it is very useful. Below is a simple example of how to implement linear regression in python using the scikit-learn library on
a simple dataset containing running distance, heart rate, self-evaluation, and sleep score. We will be going over how to use one variable to
predict another in our first example and then we will be going over how to use multiple variables to predict another in our second example.
# Simple Linear Regression
In this example, we will be using the distance of a run to predict the heart rate of a person.
### Step 1: Download the necessary packages and the data set that you would like to use. For this example, we will be using the heart rate dataset and using
the [scikit-learn library](https://scikit-learn.org/stable/modules/generated/sklearn.linear_model.LinearRegression.html), [Pandas](https://pandas.pydata.org/docs/), [Numpy](https://numpy.org/doc/) and [Matplotlib](https://matplotlib.org/stable/index.html). There are very powerful packages, in this tutorial we will only be
scratching the surface of what they can do. There are also many other packages that you can use to perform the same tasks. One of these packages is Seaborn, which is built on top of Matplotlib, for this demo we will be using Matplotlib.
```{python}
import pandas as pd
import numpy as np
import matplotlib.pyplot as plt
from sklearn.linear_model import LinearRegression
from sklearn.model_selection import train_test_split

data = pd.DataFrame({
    'Distance': [1, 2, 3, 4, 5, 6, 7, 8, 9, 10],
    'Heart-rate': [125, 130, 130, 135, 146, 142, 164, 166, 170, 172],
    'Self-Eval': [10, 15, 20, 25, 30, 35, 40, 45, 50, 55],
    'Sleep-Score': [90, 90, 90, 60, 40, 35, 40, 45, 70, 55]})
print(data.head())
```
### Step 2: Split the data into training and test sets
```{python}
X = data[['Distance']]
y = data['Heart-rate']

# 80% training, 20% testing
test_size = 0.2
X_train, X_test, y_train, y_test = train_test_split(X, y, test_size=test_size, random_state=42)
```
Splitting the data into a training set and a test set is a very important step in the process of building a linear regression model.
The training set is used to fit the model and the test set is used to evaluate the model. If you train your model on all the data that you have,
not only can this be computationally expensive but the model will "memorize" the data and will not generalize to new data that it hasn't seen before. This is called over fitting.
Although many people use a 70/30 split, in this model we decided to use a 80/20 split because the data is very small.
### Step 3: Fit the Model
```{python}
model = LinearRegression()
model.fit(X_train, y_train)

print("Slope (Coefficient):", model.coef_[0])
print("Intercept:", model.intercept_)
```
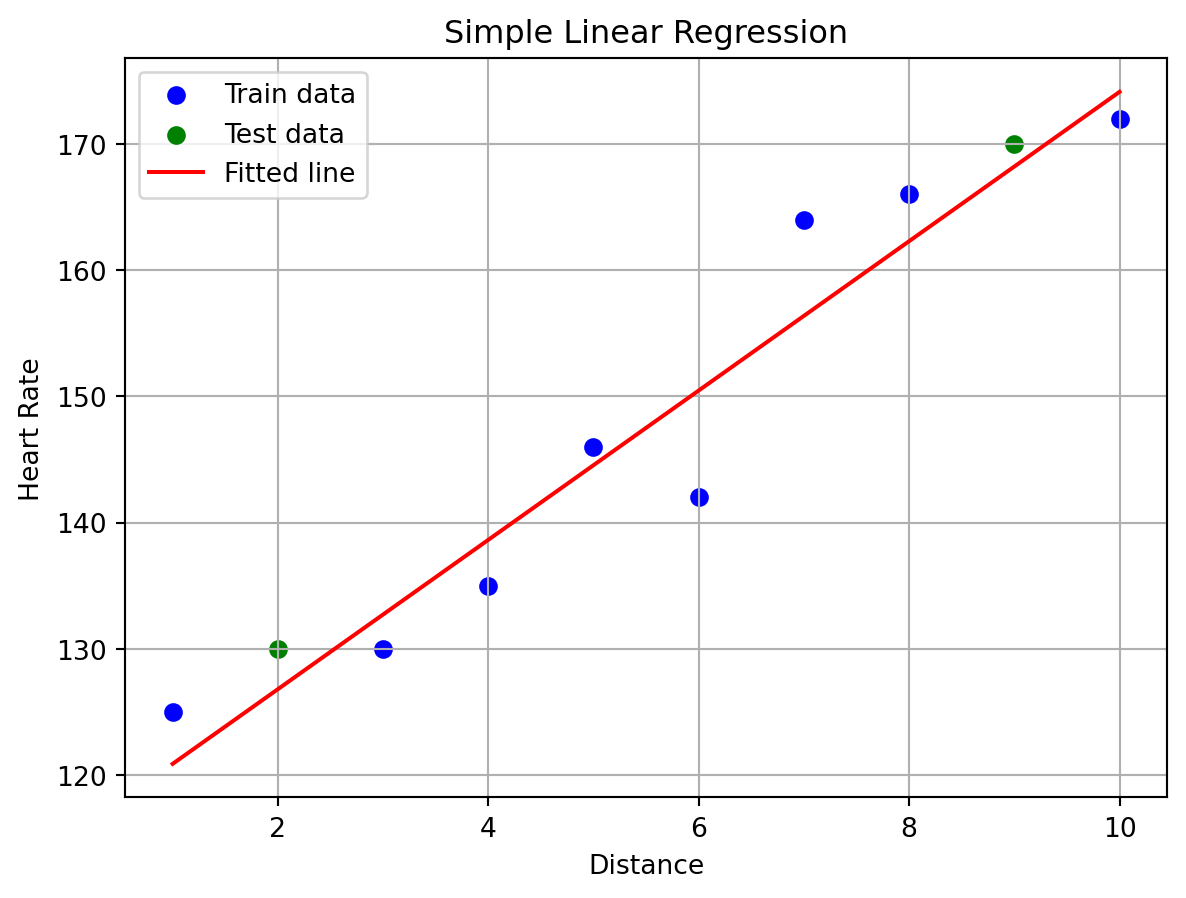
### Step 4: Visualize the Regression Line
```{python}
plt.scatter(X_train, y_train, color='blue', label='Train data')
plt.scatter(X_test, y_test, color='green', label='Test data')
plt.plot(X, model.predict(X), color='red', label='Fitted line')
plt.xlabel('Distance')
plt.ylabel('Heart Rate')
plt.title('Simple Linear Regression')
plt.legend()
plt.grid(True)
plt.show()
```
### Step 5: Evaluate the Model
```{python}
r2_train = model.score(X_train, y_train)
r2_test = model.score(X_test, y_test)
print(f"R^2 score (Train): {r2_train:.2f}")
print(f"R^2 score (Test): {r2_test:.2f}")
```
We want to evaluate the model to see how well it can predict based on the data training set.
The R^2 score is a measure of how well the model can predict the data. A score of 1 means that the model can perfectly predict the data,
while a score of 0 means that the model cannot predict the data at all. A score of 0.7 or higher is generally considered to be a good score.
Because we got a score of .92 on the training data and a .98 on the test data, we will proceed to make a prediction.
### Step 6: Make Predictions
```{python}
new_distance = np.array([[7.5]])
predicted_hr = model.predict(new_distance)
print(f"Predicted Heart Rate at {new_distance[0][0]} units: {predicted_hr[0]:.2f} bpm")
```
# Multiple Linear Regression
In this example, we will be using the distance of a run, self-evaluation, and sleep score to predict the heart rate of a person. But first
we will talk about what multiple linear regression is. Multiple linear regression is a generalization of simple linear regression
where we can use multiple independent variables to predict a dependent variable.
the equation for multiple linear regression is:
$$y=β_0 +β_1x_1 +β_2x_2 +...+β_nx_n +ϵ $$
where n is the number of independent variables and x_i is the value of the i-th independent variable.
### Step 1: Download the neceessary packages and the dataset
--We will be using the same data set as before.
```{python}
import pandas as pd
import numpy as np
import matplotlib.pyplot as plt
from sklearn.linear_model import LinearRegression
from sklearn.model_selection import train_test_split

data = pd.DataFrame({
    'Distance': [1, 2, 3, 4, 5, 6, 7, 8, 9, 10],
    'Heart-rate': [125, 130, 130, 135, 146, 142, 164, 166, 170, 172],
    'Self-Eval': [10, 15, 20, 25, 30, 35, 40, 45, 50, 55],
    'Sleep-Score': [90, 90, 90, 60, 40, 35, 40, 45, 70, 55]})
print(data.head())
```
### Step 2: Prepare the data and split the data into training and test sets and fit the model
```{python}
X_multi = data[['Distance', 'Self-Eval', 'Sleep-Score']]
y = data['Heart-rate']

X_train_m, X_test_m, y_train_m, y_test_m = train_test_split(X_multi, y, test_size=test_size, random_state=42)
model_multi = LinearRegression()
model_multi.fit(X_train_m, y_train_m)

print("Coefficients:", model_multi.coef_)
print("Intercept:", model_multi.intercept_)
```
We split the data into a training set and a test set. The training set is used to fit the model, and the test set is used to evaluate the model.
### Step 4: Evaluate the model
```{python}
r2_train_m = model_multi.score(X_train_m, y_train_m)
r2_test_m = model_multi.score(X_test_m, y_test_m)
print(f"R^2 score (Train): {r2_train_m:.2f}")
print(f"R^2 score (Test): {r2_test_m:.2f}")
```
Because our model is very simple and we got a score of .93 on the training data and a .99 on the test data, we will proceed to make a prediction.
### Step 5: Make Predictions
```{python}
# Example: Predict for Distance=7.5, Self-Eval=30, Sleep-Score=60
new_data = np.array([[7.5, 30, 60]])
predicted_hr_multi = model_multi.predict(new_data)
print(f"Predicted Heart Rate (Multiple Regression): {predicted_hr_multi[0]:.2f} bpm")
```
## Conclusion
Linear regression is a very useful tool for data analysis and machine learning, with it we can make predictions
about the relationship between two variables and can be used to predict future values based on past data.
It is very easy to implement and is very useful. Try it out yourself! If you are looking for a more in depth explanation of
[linear regression](https://www.kaggle.com/code/sudhirnl7/linear-regression-tutorial) or or looking for data sets to practice with,
check out [Kaggle](https://www.kaggle.com/datasets) to see what data sets are available and for another great demo on how to
use line regression in python.